
FIS Astec Analytics’ David Lewis continues to break down 2020 securities lending revenue figures with a forensic analysis of the numbers behind the headlines
Last month we looked at the impact of COVID-19 on the securities finance markets, with an emphasis on the level of activity and its subsequent effect on balances and incomes. That analysis showed that 2020 has, so far, shown a dip in overall revenues compared to the prior year. In fairness, 2019 was a high-performing year and one of only two to rack up more than $10 billion in revenue since 2008.
Our analysis also showed that the volume of securities borrowed dropped only a small amount, while availability grew as new funds and assets came to market. The resultant effect on fee and rebate levels was unsurprising, dropping 11-24 percent per quarter. These are all high-level measures though. What was happening at the more regional or asset-class level?
This month we drill down another level to look at the more granular details behind the headline numbers. These numbers plotted the revenue declines seen so far, in what has been an exceptional year, albeit for all the wrong reasons.
Understanding market availability
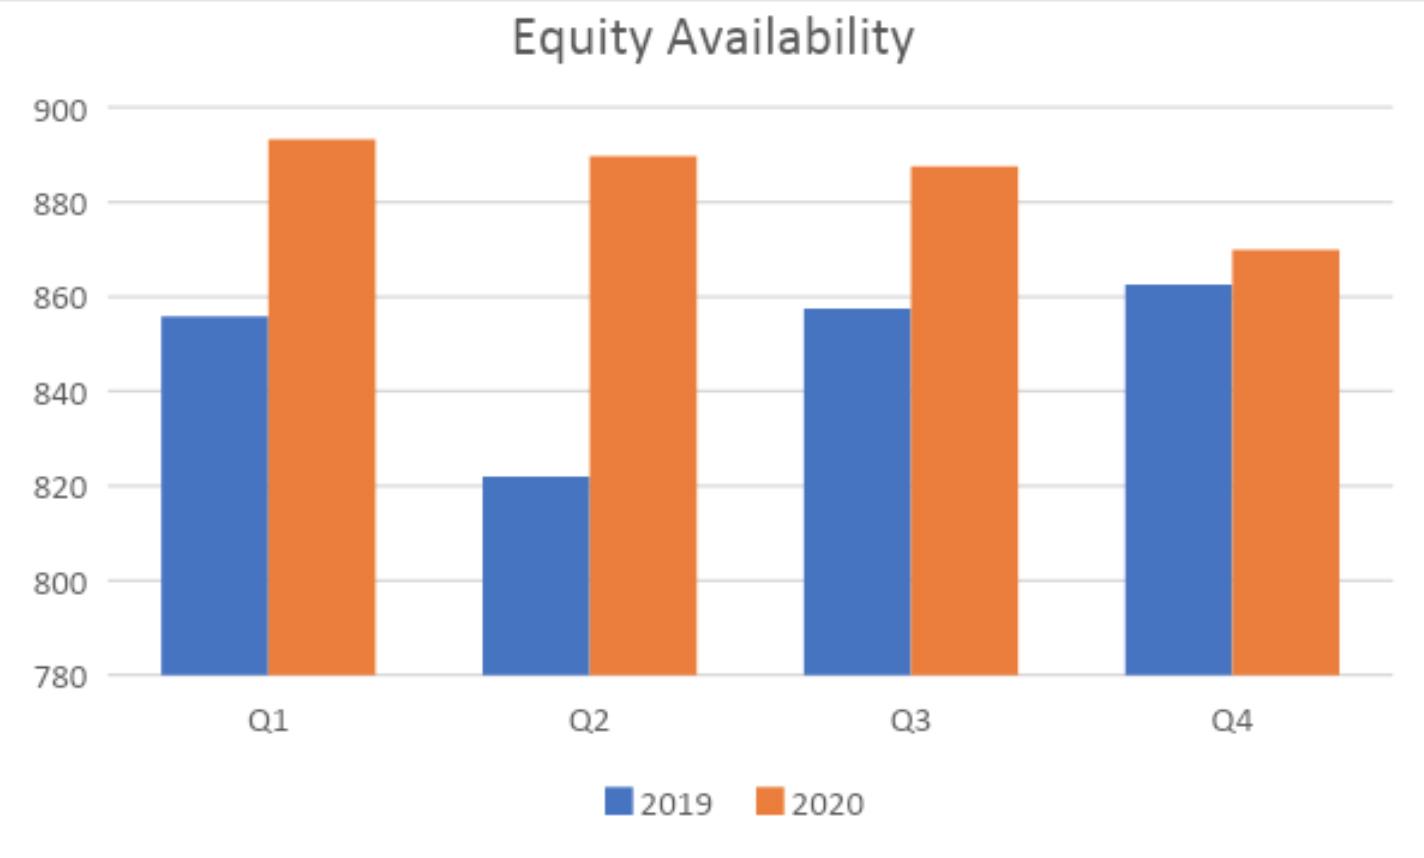
Availability increased in three of the four quarters through 2020, with only the last quarter falling short to date. Where that inventory came from may surprise some, with equity assets leading the way as figure 1 shows. Fixed income assets remained near flat for the first two quarters with a drop of around 6 percent in quarter three and a much more significant drop of around 18 percent in the final quarter. The fourth quarter is not over, of course; this statistic is as at the time of writing.
Where are the additional equity assets coming from? Equity availability in Europe, the Middle East and Africa (EMEA) increased in every quarter compared with prior periods. Q2 was the standout, with a rise of some 13 percent over the volume available in the same period in 2019. This may well have been a direct response to the volatility created as the economic impacts of COVID-19, in terms of depth and duration, became more apparent. The first, third and fourth quarters also displayed an increase in equity availability in EMEA, specifically 8 percent, 9 percent and 7 percent respectively.
Asia Pacific (APAC) saw much lower level changes, rising in the first half of the year by 2 percent and 5 percent but falling back in the second half, dropping inventory volumes by 1 percent and 5 percent over the third and fourth quarter.
Like APAC, the Americas changed by much smaller amounts than in EMEA, but availability did rise on every quarter compared with 2019 and did so from a much higher baseline. Across the four quarters respectively, North and South American equities availability increased by 1 percent, 5 percent, 2 percent and 2 percent respectively.
Fixed income asset availability fell by around 3 percent in the first quarter, was relatively flat to 2019 in the second but displayed much bigger falls in the third and fourth quarter, specifically 6 percent and 18 percent. Again, the fourth quarter is a to date number and may change toward year end.
Regionally speaking, EMEA saw strong rises in fixed income asset availability in the first three quarters, exceeding 2019 by 7 percent, 8 percent and 4 percent respectively. With the caveat that we are only halfway through the final quarter and average availability over this period may change, the fourth quarter has witnessed a significant drop of over 30 percent compared with 2019. APAC saw a flat second quarter, but drops of 7 percent, 10 percent and 18 percent in the first, third and fourth quarters respectively.
Finally, the Americas. Fixed income availability has fallen across the whole year, albeit by smaller percentages than some of the other regions. Looking at the four quarters chronologically shows falls of 1 percent, 2 percent, 4 percent and 8 percent respectively. Across all regions, it is the fourth quarter which displays the biggest changes with regards to fixed income assets at least, perhaps indicating a shift in investment profiles among the larger institutional funds that feed the lending markets.
Comparing loan volume across regions
Availability isn’t everything of course. In fact, looking at the overall impact to market revenues in 2020, the rise in availability most likely pushed fee levels downward as increased supply reduced scarcity premiums. Overall, as reviewed last month, balances were down every quarter, perhaps by a lower margin than many expected, while fee levels displayed much more serious declines.
Looking at the regional data and analysing the 51,000 plus securities across our global data sample by country of issue highlights some interesting results. In general, we have seen that equity loan volume has increased across the past three quarters of 2020 compared with 2019, having fallen some 5 percent in the first quarter, but looking at the regional differences shows that EMEA remained relatively flat in the first quarter, down around 1 percent, then grew increasingly rapidly across the remainder of the year. Equities on loan, measured in share volume rather than value, grew by 6 percent, 17 percent and 28 percent across the second, third and fourth quarters, indicating a significant jump in equity borrowing. This may well reflect market volatility and increased position taking by both long and short investors as 2020 unfolded.
Looking at the APAC region, a similar pattern emerged but with a more pronounced dip in the first quarter. Equity activity fell some 6 percent compared with quarter one 2019, but then advanced slightly more slowly than EMEA through the rest of the year, notching up gains of 12 percent, 12 percent and 21 percent over the final three quarters of 2019.
Equity borrowing activity in the Americas bucked the trend somewhat. The first quarter displayed a fall similar to APAC, with equity volumes borrowed down by around 5 percent. However, despite a small gain of 3 percent in the second quarter over the same period in 2019, the relief was short lived. The third and fourth quarters witnessed drops in equity activity of 8 and 10% respectively.
Positions were almost mirrored in fixed income, with EMEA seeing an early gain of some 10 percent in the first quarter followed by falls of 10 percent, 5 percent and 6 percent across the following three respectively. For APAC, fixed income asset borrowing slumped 21 percent in the first quarter, followed by another painful quarter with balances down some 6 percent. The last half of 2020 has shown some relief with balances up 8 percent and 17 percent over the same periods in 2019.
Looking to the Americas, where fixed income borrowing towers over activity anywhere else on the globe, fixed income balances were up across every quarter – specifically 7 percent, 13 percent, 7 percent and 7 percent. This was achieved despite reduced availability across every quarter.
2020 has been a truly unusual year, and it is not over yet. The data shows that not all markets are the same, with investors and lenders together with borrowers responding differently to a uniquely global issue that is the COVID-19 pandemic. With six weeks yet to go, there may be more surprises yet from 2020.
Figure 1