

Reflecting on the past 12 months of market data, FIS’ David Lewis observes that securities finance is getting ever more complex and busy, generating pressure on margins as work levels rise proportionally faster than revenue generation
Few would deny that the past few years have been exceptional. Not only was there a global pandemic, but now the spectre of war looms large over Europe, affecting almost every nation on earth in some way. Falling demand for travel, national lockdown orders and wide-ranging impacts to economic activity of all types have affected the global economy in ways many never thought possible. Significant upticks in quantitative easing actions to shore up industries and employment will cast a shadow over economies and national debt piles for years to come.
Even fewer people would have then predicted war, with the impact on fuel and food costs forcing inflation to run rampant, squeezing economies just as they were looking to a post-pandemic recovery. Under normal circumstances, the securities finance and collateral markets revel in volatility as demand for borrowing securities intensifies and speculation on market movements ramps up. Add to that the need to shore up positions with higher quality collateral and the market gets an overall boost. To that end, others have reported a gain in revenues this February compared to last, rising some 2 per cent year-on-year. But are these numbers in line with expectations? Do they correlate with market movements and the frenetic uptick in activity?
One of the original purposes behind the benchmark data services available on the market today was to answer a difficult question for beneficial owners. They needed to know if they were getting the right level of lending income for their funds and, arguably more importantly, the right income for the risks taken and effort expended. For the past 20 or so years, beneficial owners have been able to benchmark their results against funds like them and the wider market, providing a view of how well they, and their agent, were doing. Similarly, the market participants can do the same exercise themselves and understand how well they are managing their programme and their clients. But what does the entire market benchmark itself against? The only relevant data in that regard is historical performances and, as we all know, the value of your investment can rise and fall.
Rising loan counts
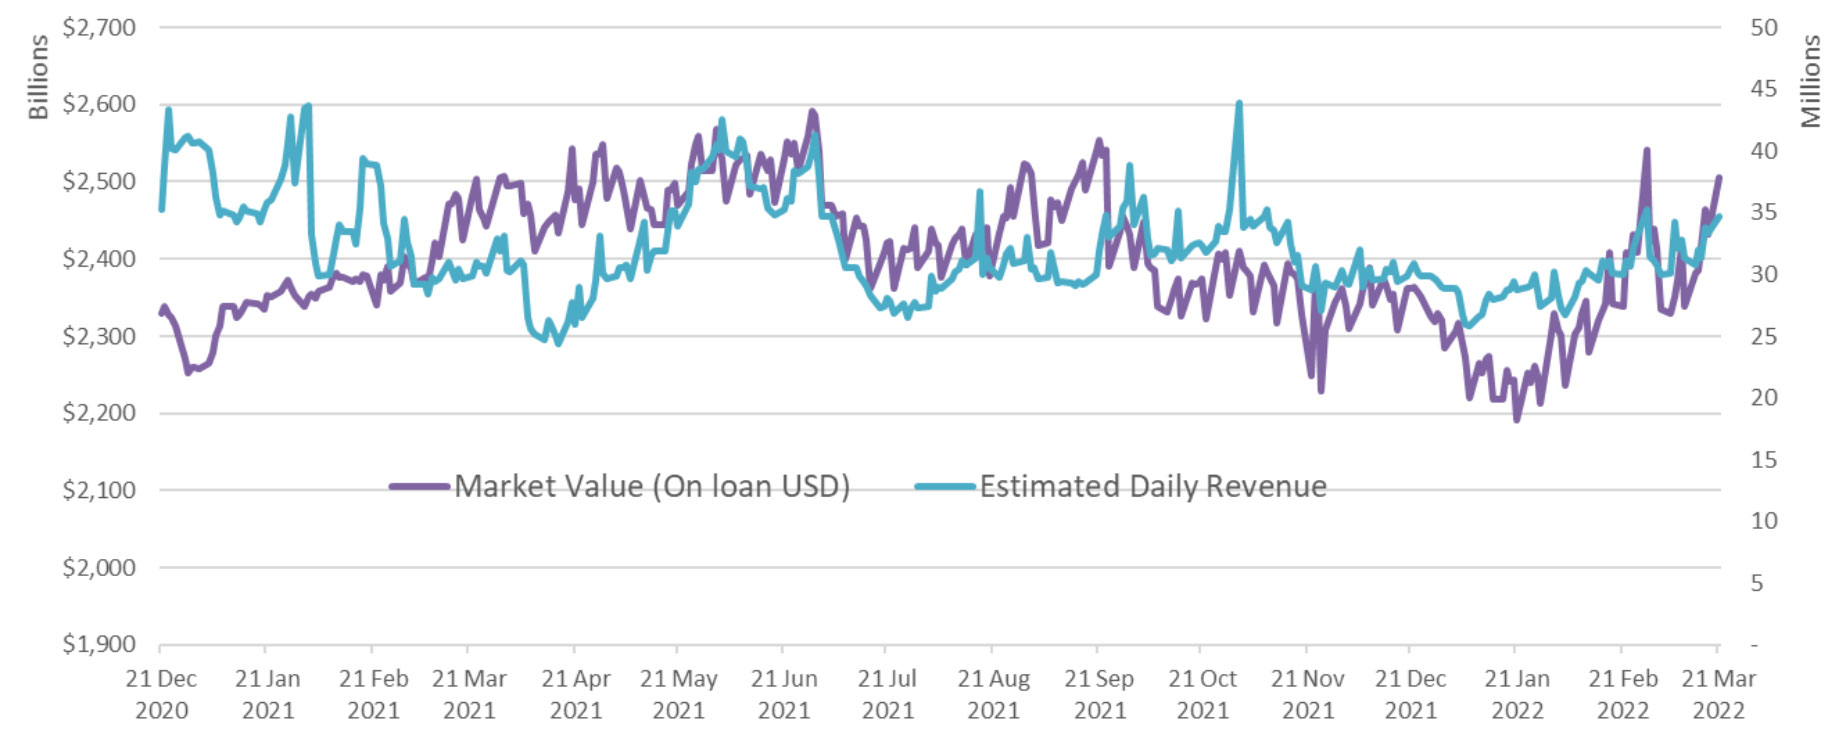
The last 12 months of data indicates another year of gross revenues well north of US$10 billion, as shown by Figure 1. But in the same way we look at individual funds and beneficial owners, the overall revenue number is very one dimensional compared to the multi-dimensional world in which securities finance lives. Agent lenders would often describe their programmes as providing good returns by focusing on high quality loans, or those of good intrinsic value, as a means to differentiate themselves in a crowded market. Quality loans are another term for long duration or high utilisation, while higher intrinsic value programmes steered away from cheap general collateral to focus on higher fee or lower rebate higher demand securities, applying the 80:20 rule to income and volume metrics.
Figure 1
The whole market revenue may have been up in February, following a small dip in January, but what of the other dimensions? In 2020, the average outstanding loan count per day stood at 2.32 million, while 2021 saw averages increase slightly to 2.37 million a day – a rise of around 2 per cent overall. However, 2022 has started fast. The first quarter of 2022 has seen loan counts average 2.71 million per day. This represents an increase of 14 per cent over 2021 and 17 per cent over 2020.
The rise in the number of lent units was even more remarkable, where units is used to describe individual assets (an equity or a bond) across all security types. In 2020, lent units averaged 2.06 billion; 2021 saw this jump to over 3.27 billion. Again, 2022 is pushing activity even higher and 2022 year-to-date shows the number of units on loan averaging just over 4.05 billion per day, a rise of almost 97 per cent compared to 2020 and 24 per cent over 2021.
The intrinsic loan rates earned on these securities have not changed significantly, however. 2020 saw a global average of around 45 basis points. The 15 months to date, as shown in Figure 1, averages out at 49 basis points, barely 10 per cent over where the markets were in 2020, despite the extraordinary market events and significant volatility in asset values between those periods.
The value of lent assets has risen with 2020 seeing an average of between US$1.9 trillion and US$2.0 trillion on loan, while 2021 saw that rise to over US$2.4 trillion as a daily average. 2022 is seeing those values rise even higher, averaging over US$2.5 trillion. This is despite the global fall in asset prices at the start of 2022, where, for example, the S&P500 has fallen by around 7 per cent year-to-date. While the rising loan valuations, combined with a steady level in intrinsic rates of around 47 basis points overall, are providing a solid level of income across the market, the other statistics suggest that all the market participants are having to work disproportionately harder to maintain those levels.
A 17 per cent increase in loan count is a more important statistic than it might at first appear. For every additional loan there will be extra settlement, reporting, marking, reconciliation, billing and, potentially, corporate action activity. All these cost money and effort for all concerned, arguably making margins even tighter just as regulation and other costs exert more pressure on the marketplace.
The importance of a coherent technology strategy delivering improved automation and straight-through processing has never been more important. Our market is getting ever more complex and busy, with increasing pressure on margins as work levels rise proportionally faster than revenue generation. Next time you ask someone you know in the securities finance and collateral markets how they are doing, and they say, “Not too bad, busy,” they may just be right.