
Q2 revenues grew by 13 per cent YoY to US$2.85 billion, with lending revenues from exchange-traded products having their best quarter on record. IHS Markit’s Sam Pierson dissects the numbers
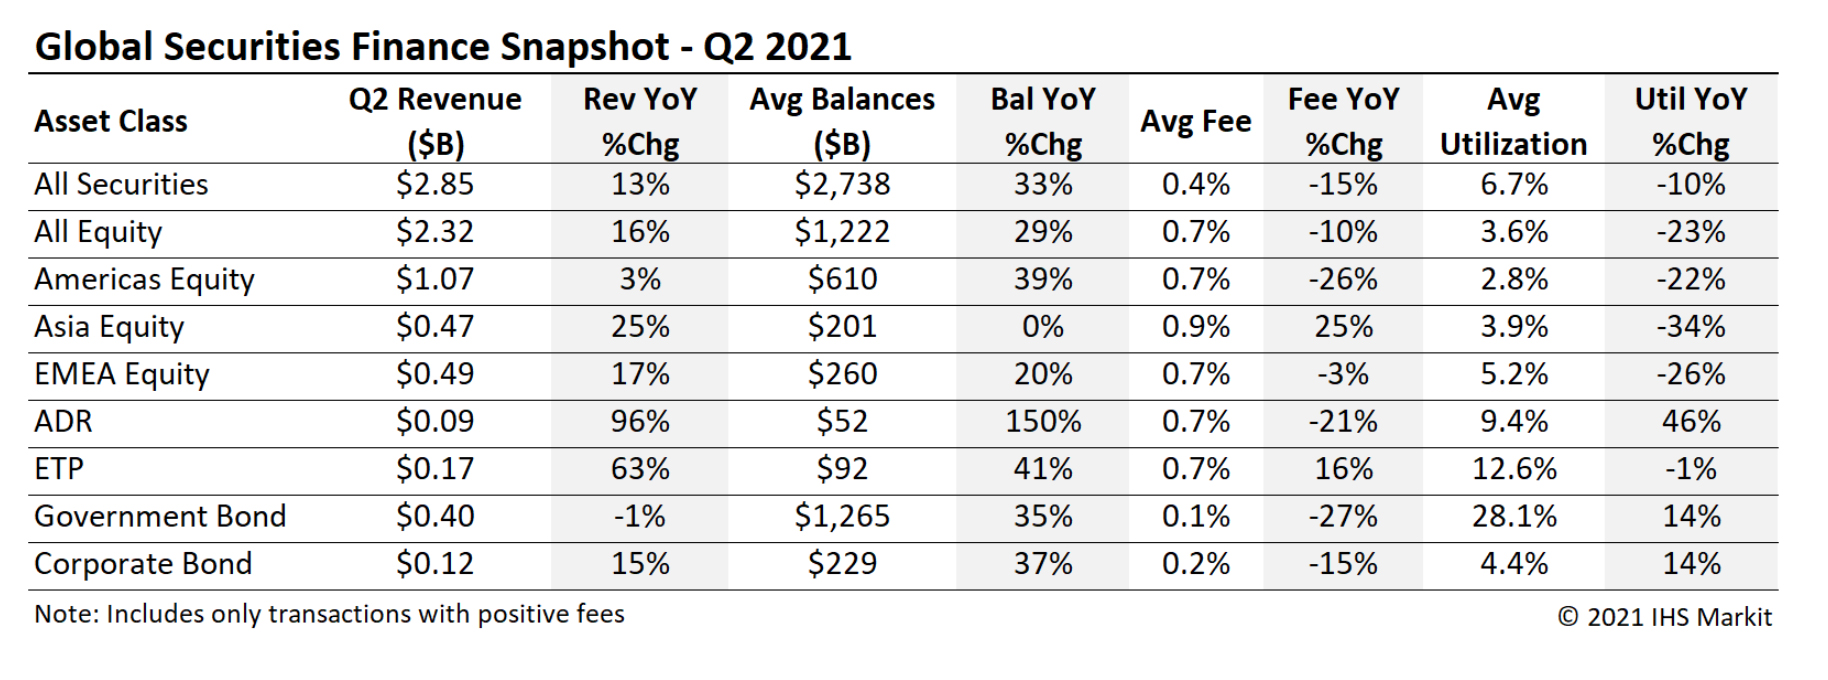
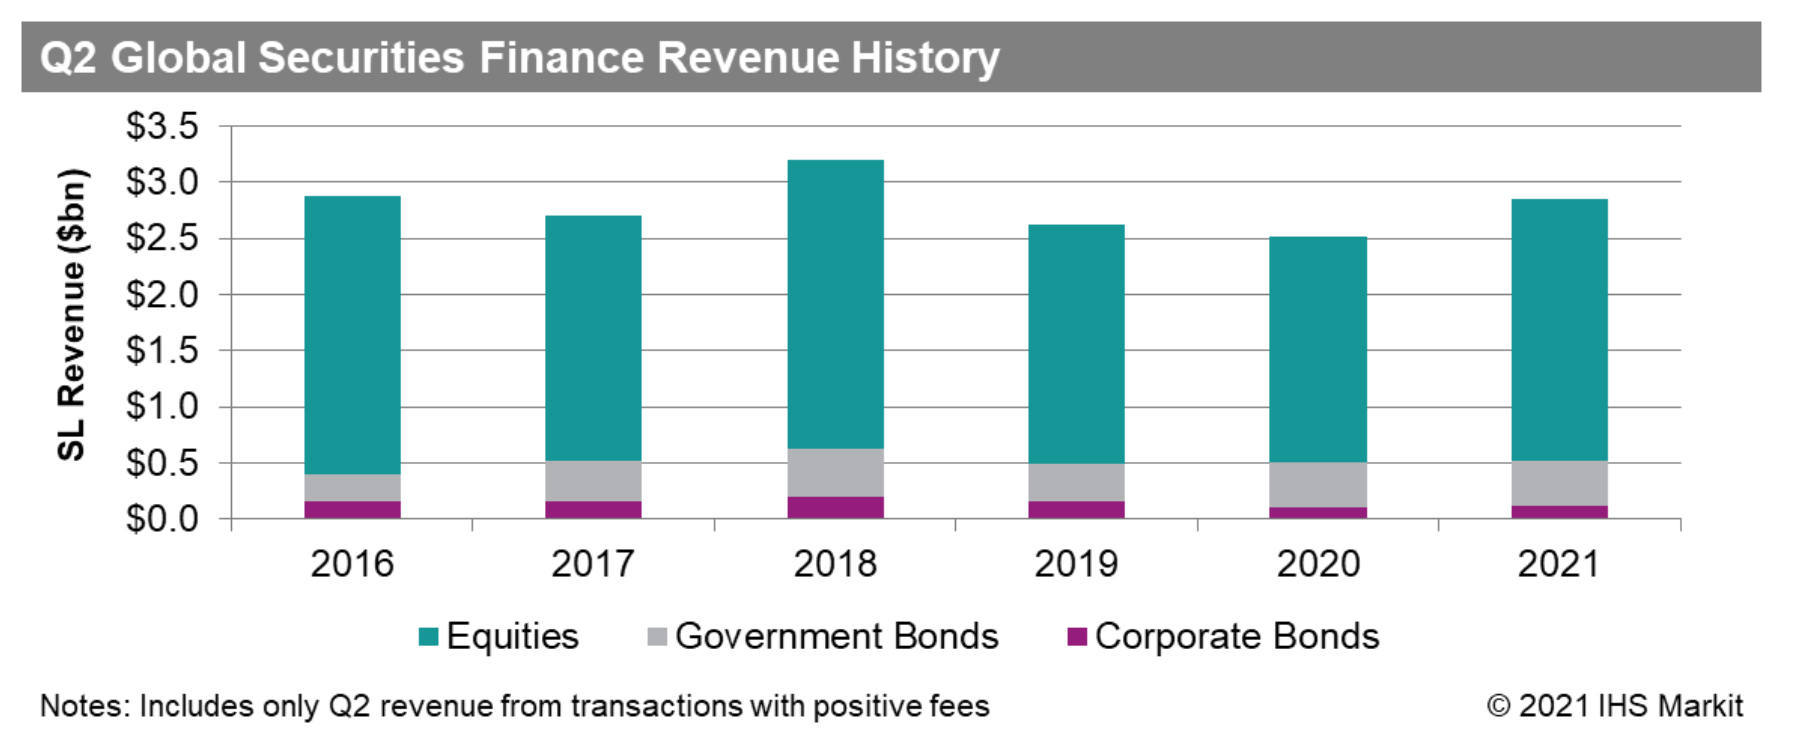
Global securities finance revenues totalled US$2.85 billion in Q2 21, a 13 per cent YoY increase. This revenue growth made Q2 the best quarter for securities finance revenue generation since Q2 2018.
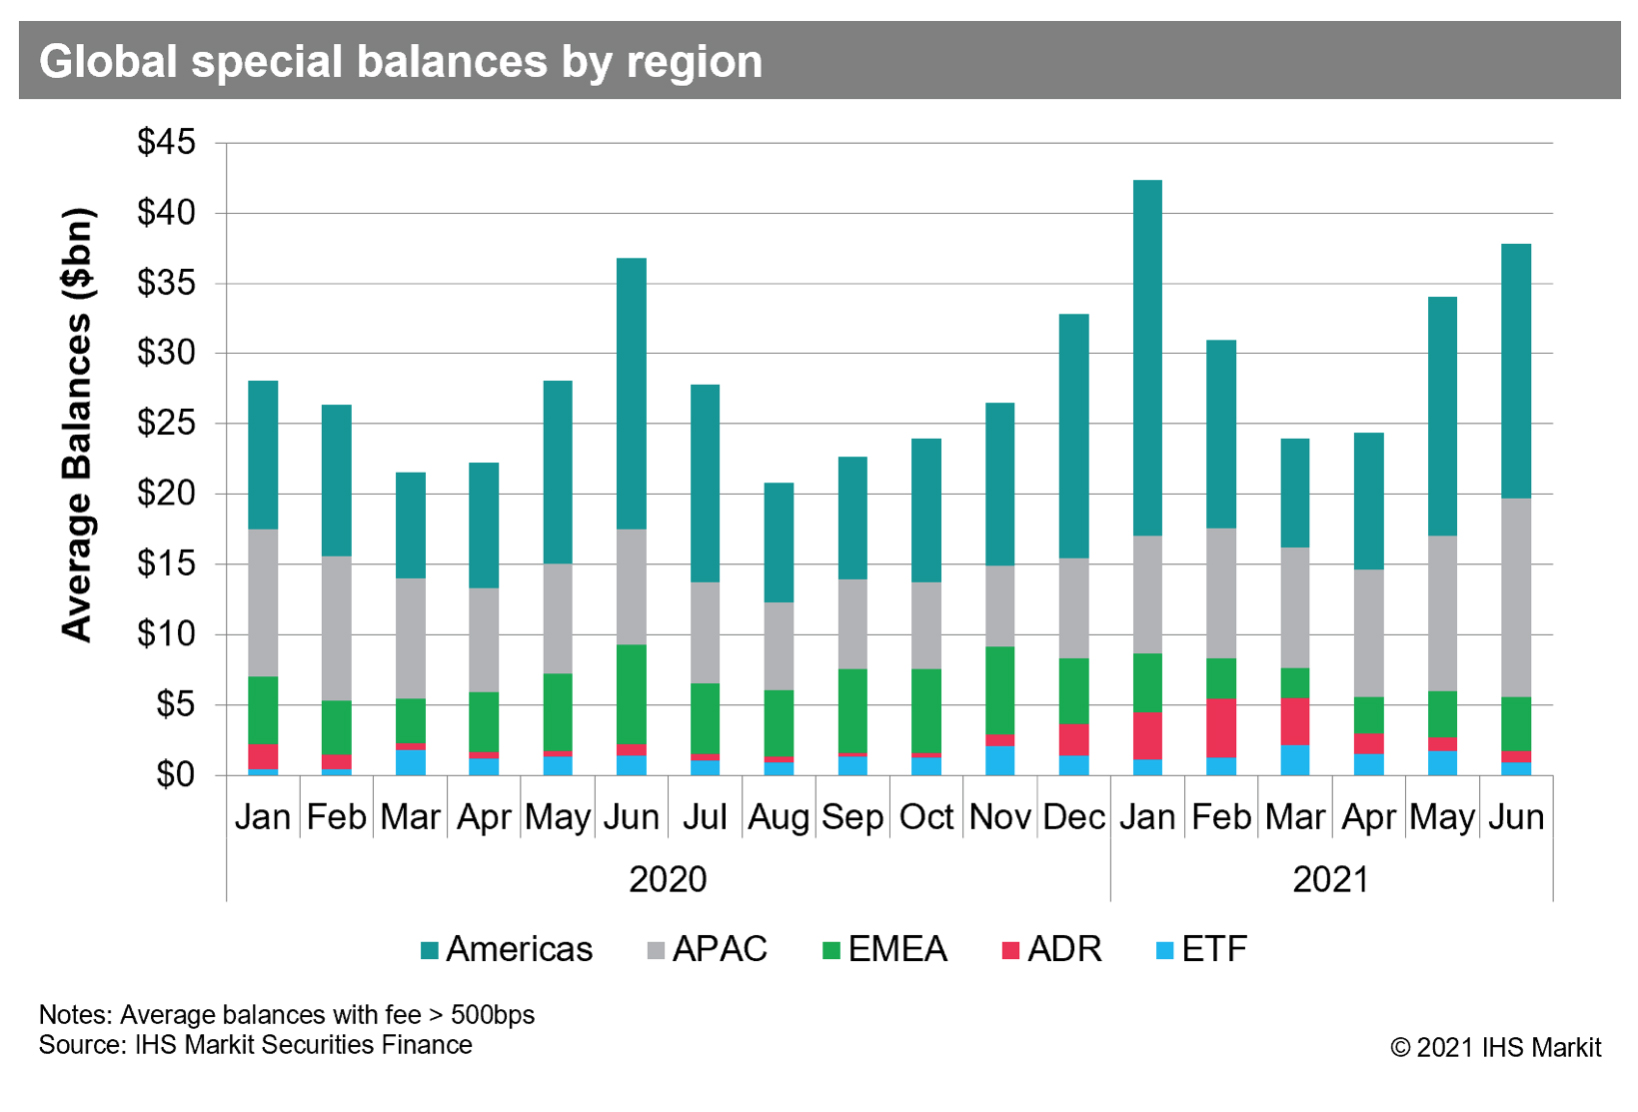
Following a boom-and-bust first quarter for equity specials, special balances increased steadily during Q2, driven by US equities and emerging markets in APAC. Borrower demand for ETFs continues to boost returns, particularly for credit and emerging market products.
Equities
Global equities delivered US$2.3 billion in revenue during Q2 21, a 16 per cent YoY increase. The second quarter built from a slow start in April, the weakest month so far this year for revenue generation, before returns rebounded strongly during May and June. Q2 was the third consecutive quarter to deliver QoQ revenue growth, starting from the 2020 low-point observed in Q3.
In 2020 a summer slow-down in markets activity, particularly in August, caused equity finance revenues to drop off sharply. Whether 2021 repeats the summer slowdown of 2020 remains to be seen. However, some of the Q2 revenue drivers are likely to persist into Q3.
APAC equity revenues have grown by 25 per cent YoY to US$472m, with each month during Q2 delivering a YoY revenue increase of at least 19 per cent. The upswing has been driven by the resumption of short selling in South Korea, along with increasing borrower demand in Taiwan and Hong Kong SAR.
Revenue growth in the region is partly the result of a light YoY comparison, with short sale bans and lower balances coming in the wake of the Covid-19 crash; revenues for Q2 fell 1.4 per cent short of the Q2 2019 return. Hong Kong SAR’s equity finance revenues exceeded those of Japan, as the primary equity market in the region in terms of quarterly revenue generation, for the first time since Q4 2015.
America’s equity finance revenue in Q2, at just over US$1 billion, reflected a 3.5 per cent YoY increase and a 5 per cent sequential (ie QoQ) increase. June was the most successful month during Q2 for revenue generation, but the only month to see a YoY decline in returns as a result of particularly strong returns 12 months previously. The uptrend in revenue growth within the quarter was driven both by increasing total on-loan balances and an increasing portion of balances with high-fees.
US equity finance revenue of US$979 million in Q2 reflects a 7.6 per cent YoY increase. In contrast, Canada’s equity revenues declined by 29 per cent YoY to US$84 million.
EMEA Q2 equity finance revenues of $494 million reflect a 17 per cent YoY increase, with June the only month during Q2 to record a YoY revenue decline. This YoY increase was driven particularly by the reinstatement of dividends, which had been suspended or reduced in 2020. However, EMEA Q2 revenues were down by 30 per cent compared with Q2 2019. The French equity market delivered the most revenue among EMEA markets in Q2, overtaking the German market (which led Q1).
Equity on-loan balances with positive spreads averaged US$1.2 trillion in Q2, a 29 per cent increase YoY, largely driven by recovering equity market valuations over the last year. Despite loan balance growth, global equity utilisation has resumed a multi-year downtrend, which took a brief pause amid the Covid-related sell-off in 2020. The Q2 average global equity utilisation of 3.6 per cent is the lowest for any quarter on record.
Global equity special balances rebounded in Q2, following a year-to-date low point observed in March. APAC equity special balances recorded the most notable uptick in Q2, owing to the reinstatement of short selling in South Korea and a general upturn in demand for hard-to-borrow shares in Hong Kong SAR, Taiwan and Malaysia.
Average APAC equity special balances averaged $11.4 billion in Q2, compared with $8.7 billion in Q1 and $7.8 billion in Q2 2020.
For the Americas, equity special balances declined by 3 per cent compared with Q1 but the shortfall was entirely the result of the January short squeeze in hard-to-borrow shares. EMEA equity special balances declined by 42 per cent YoY, with the shortfall primarily the result of German equity special balances being consistently high in 2020. Specials balances for ADRs surged in late-2020 and early-2021 on the back of outsized borrower demand for Futu Holdings. Subsequently, ADR special balances declined in Q2 following the wrap-up of the Futu trade, though overall borrower demand for depository receipts remains strong.
Exchange Traded Products
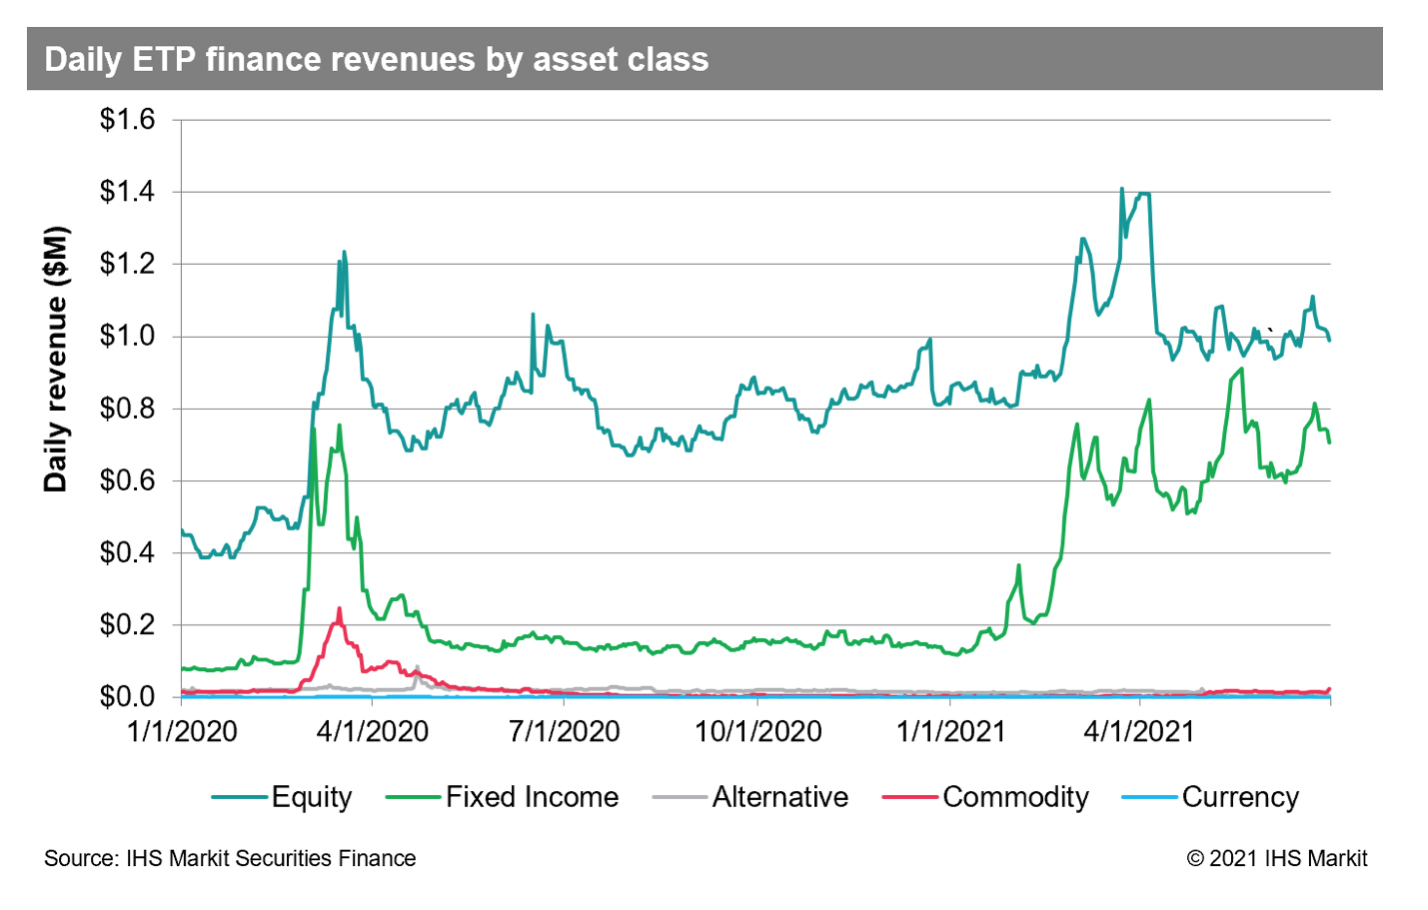
Global exchange-traded product (ETP) revenues totalled US$171 million for Q2, a 63 per cent YoY increase. Loan balances set a new quarterly average high of $92 billion, reflecting increased use of these products for hedging. Lendable asset values also set a new all-time quarterly average high of $444 billion.
Fixed income products generated 39 per cent of Q2 revenues, up from 27 per cent in Q1. US listed products generated 80 per cent of Q2 revenues, up from 74 per cent in Q1. APAC ETP revenues declined by 32 per cent YoY for Q2, but that was partly the result of strong results in 2020 — revenues only contracted slightly QoQ compared with Q1. EMEA ETP revenues increased 3 per cent YoY.
Fixed Income
Fee-spread revenues for global sovereign debt totalled US$398 million for Q2, a 1 per cent YoY decline. Borrower demand for government bonds remains robust, with $1.26 trillion in positive-fee global balances for Q2 reflecting an 35 per cent YoY increase. The $330 billion increase in positive-fee balances is the result of a $247 billion YoY increase in total on-loan balances. along with $82 billion moving from negative to positive fees.
Total Q2 government bond lending revenues for agency programmes, which amounted to $408 million including reinvestment returns and negative fee trades, declined by 18 per cent YoY. Reinvestment revenue declined by 47 per cent YoY, while fee spread revenues increased by 25 per cent YoY. Following the decline in interest rates during the latter half of Q2, a marginal decline in government debt on-loan balances may be the start of an unwind of trades predicated on rate path and yield curve. However, balances remain relatively high in historical terms.
For corporate bonds, fee spread revenues totaled $121 million for Q2, a 15 per cent YoY increase. Corporate bond borrower demand continues to increase — $229 billion of daily average balances in Q2 represented a 37 per cent YoY increase and the highest quarterly average since Q3 2008. Total Q2 corporate bond lending revenues for agency programmes, at $115 million including reinvestment returns and negative fee trades, declined by 29 per cent YoY.
During Q2, reinvestment revenue declined by 59 per cent YoY while fee spread revenues increased by 19 per cent YoY. While corporate bond loan balances are historically high, there has been a lack of hard-to-borrow issues. To the extent that credit stress increases in the second half of the year, the asset class could get back to delivering stellar lending returns — as they did in 2018, the strongest year for corporate bond lending since 2008 in revenue terms.
Conclusion
Global financing revenues for Q2 were in the middle of the range observed over the preceding five years. However, it was the strongest second quarter for equity finance revenues since 2018. The upswing in equity revenues was driven by the pick up in APAC specials, dividend reinstatement in EMEA and IPO/SPAC-related demand in the US.
Taken together, the drivers for equity borrowing demand that were anticipated coming into 2021 are largely playing out and delivering returns. Heading into the second half of the year, APAC specials, ETP demand and US SPACs and IPOs appear likely to continue to boost returns.
For fixed income, the big picture is drawn from greater loan balances and narrower spreads. Revenue from rates-related trades may decline, though there is potential for credit risk to drive borrowing demand for corporates, which could result in hard-to-borrow credits becoming a H2 return driver.
H1 revenues of $5.5 billion reflect a 14.3 per cent YoY increase in fee-based revenues.