-part-1.jpg)
H1 sec finance revenues hit highest levels since 2008
25 July 2023
Matthew Chessum, director of securities finance at S&P Global Market Intelligence, reviews performance in global securities finance markets during H1 2023 and explains how monetary tightening, AI-driven equities rallies and US banking failures are combining to drive trading activity across the sector
 Image: Shutterstock
Q2, and indeed H1 2023, provided a vibrant backdrop for market participants. Regional bank failures in the US, some of the largest swings in bond yields ever recorded, a doubling down in the fight against inflation with steep and regular interest rate hikes, a debt ceiling cliff edge, and the emergence of a new artificial intelligence market rally, account for just a small number of market events that securities lenders have had to navigate. Throughout all of these different scenarios, the securities finance markets continued to provide liquidity to market participants in a risk-adjusted manner, helping investors to seize opportunities to generate additional returns and to manage their investment risk.
These conditions, while being very different to anything experienced for many years, provided the fertile ground required for securities lending to thrive. During the first half of the year, securities finance revenues have reached levels not seen since 2008. While being a little way off 2008 levels (securities finance revenues were US$8.40 billion in H1 2008 and US$7.02 billion in H1 2023), revenues have remained elevated throughout the period.
Looking at H1 returns, revenues increased 16 per cent year-on-year to US$7.02 billion. Drilling down into these numbers, all asset classes outperformed YoY over the H1 period apart from exchange traded products. Revenues from equities increased 14 per cent YoY to US$5.394 billion. In the fixed income markets, government bond revenues grew by 11 per cent YoY to US$966 million, while corporate bonds continued to generate very strong returns, rising 37 per cent YoY to US$594 million. Exchange traded products generated US$316 million in revenue during the first half of the year, which represented a decline of 30 per cent YoY.
Across the equity markets, Americas equities were once again the hero, producing an incredible US$2.825 billion in revenues. Average fees increased 29 per cent YoY, standing at 86bps over H1. Asian equity revenues climbed 1 per cent over the six-month period to US$1.038 billion and EMEA equities experienced revenue growth of 14 per cent over H1 to US$966 million.
Equity markets have experienced impressive growth when compared to H1 2022. An increase in average fees has been an important driver for revenue growth across the asset class, with fees across all equities climbing 19 per cent YoY to 87bps. In contrast, loan balances declined 5 per cent YoY, lendable declined 5 per cent and loan utilisation remained flat. The increase in average fees was a result of a very strong specials market in the US, higher fees in some European markets — particularly Switzerland, Sweden and France — and an improvement in securities lending activity in some of the high value Asian markets such as South Korea and Taiwan.
The performance of the specials market has been well documented this year, but figures seen during H1 2023 have set new records (fig 1). US equities have seen the vast majority of specials activity, generating US$2.049 billion in revenues over the first six months of the year. To put this into context, this represents a 44 per cent increase on 2022 (H1 2022 revenues were US$1.40 billion, H1 2021 revenues were US$1.29 billion and H1 2020 revenues were US$1.18 billion). Again, this is the highest revenue figure seen since our data collection started.
Fig 1: Equity specials revenues by region for H1 2023 (US$ billion)
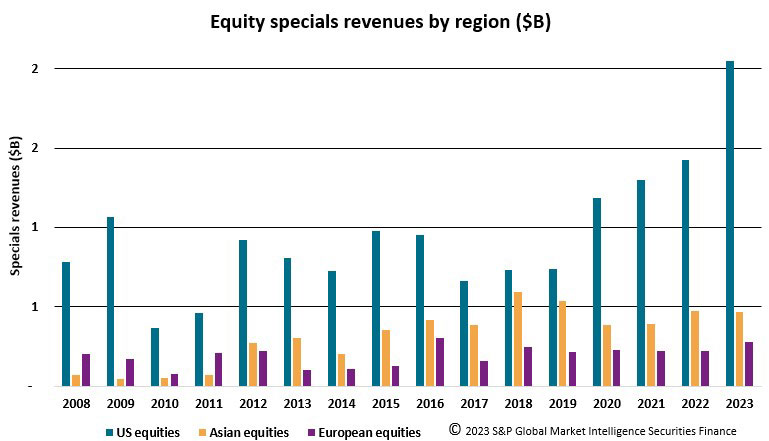
Over the course of H1, US equities specials revenues were strongest in April at US$393 million, derived by lending assets with average fees greater than 500bps. During this month, 77 per cent of all US equity revenues were generated by specials trading. Over the six-month period, an average 78 per cent of all monthly revenues were generated by specials, which accounted for an average 3.2 per cent of all balances. As long as recall risk is managed effectively, this market has been very good at generating exceptionally strong risk-adjusted returns for lenders.
Across Asia, US$469 million was generated in specials revenue, making H1 2023 the fourth-best period since 2008. In Europe, US$279 million was generated from specials activity over the period, making it the second-best H1 for specials revenues since 2008. For EMEA, record H1 specials revenues were attained in 2016 at US$303 million.
A similar story played out across fixed income markets, with strong demand across both government and corporate bonds as interest rates continued to rise, economic data kept surprising to the upside and inflation remained stubborn across numerous jurisdictions worldwide.
Government bonds experienced increased volatility, especially over the second quarter of the year, as the US debt ceiling discussions pushed borrowing rates higher across US treasuries and caused balances to decline. Short-dated government bonds remained in demand as borrowers required additional liquidity and directional demand increased. Short-dated bonds are the most sensitive to immediate rises in interest rates and, given the lack of clarity surrounding any decline in the rate of inflation throughout the majority of the H1 period, these bonds remained in high demand throughout. Revenues generated by government bonds increased 11 per cent YoY. In contrast, average fees were 18bps, balances declined by 17 per cent YoY and utilisation contracted by 19 per cent.
Corporate bonds continued to experience gains throughout the period. Average fees hit an impressive 46bps (a 47 per cent rise YoY), pushing revenues up by 37 per cent to US$594 million. However, balances declined by an average of 8 per cent over the period. Corporate bonds have been a strong driver of revenues for the last 18 months. However, towards the end of the Q2 period the recent increases experienced in both fees and revenues started to taper off. Corporate bond revenues hit US$298 million during Q1 and declined very slightly to US$296 million during Q2.
Average fees also fell by 1bps. During June, average fees fell to 44bps, their lowest monthly average since November 2022. It is therefore possible that corporate bond returns have reached their peak.
The first half of 2023 gave securities lenders a lot to be thankful for. Higher average fees have contributed to higher revenues and, for those lenders that held any of the assets that were trading special, very strong risk-adjusted returns. Market conditions have started to change as we head into H2 and Q3. Equity markets continue to rally, inflation in the US has started to fall and the possibility of soft landings across multiple regions seems to be an increasingly likely scenario.
As always, the broader market backdrop will continue to shape activity levels in securities finance markets. Despite the recent changes in market conditions, we can conclude from H1 2023 that we should take nothing for granted. As the speed of market changing events has increased and regional economic divergences become more pronounced, pockets of opportunity are still likely to exist for some time to come.
These conditions, while being very different to anything experienced for many years, provided the fertile ground required for securities lending to thrive. During the first half of the year, securities finance revenues have reached levels not seen since 2008. While being a little way off 2008 levels (securities finance revenues were US$8.40 billion in H1 2008 and US$7.02 billion in H1 2023), revenues have remained elevated throughout the period.
Looking at H1 returns, revenues increased 16 per cent year-on-year to US$7.02 billion. Drilling down into these numbers, all asset classes outperformed YoY over the H1 period apart from exchange traded products. Revenues from equities increased 14 per cent YoY to US$5.394 billion. In the fixed income markets, government bond revenues grew by 11 per cent YoY to US$966 million, while corporate bonds continued to generate very strong returns, rising 37 per cent YoY to US$594 million. Exchange traded products generated US$316 million in revenue during the first half of the year, which represented a decline of 30 per cent YoY.
Across the equity markets, Americas equities were once again the hero, producing an incredible US$2.825 billion in revenues. Average fees increased 29 per cent YoY, standing at 86bps over H1. Asian equity revenues climbed 1 per cent over the six-month period to US$1.038 billion and EMEA equities experienced revenue growth of 14 per cent over H1 to US$966 million.
Equity markets have experienced impressive growth when compared to H1 2022. An increase in average fees has been an important driver for revenue growth across the asset class, with fees across all equities climbing 19 per cent YoY to 87bps. In contrast, loan balances declined 5 per cent YoY, lendable declined 5 per cent and loan utilisation remained flat. The increase in average fees was a result of a very strong specials market in the US, higher fees in some European markets — particularly Switzerland, Sweden and France — and an improvement in securities lending activity in some of the high value Asian markets such as South Korea and Taiwan.
The performance of the specials market has been well documented this year, but figures seen during H1 2023 have set new records (fig 1). US equities have seen the vast majority of specials activity, generating US$2.049 billion in revenues over the first six months of the year. To put this into context, this represents a 44 per cent increase on 2022 (H1 2022 revenues were US$1.40 billion, H1 2021 revenues were US$1.29 billion and H1 2020 revenues were US$1.18 billion). Again, this is the highest revenue figure seen since our data collection started.
Fig 1: Equity specials revenues by region for H1 2023 (US$ billion)
Over the course of H1, US equities specials revenues were strongest in April at US$393 million, derived by lending assets with average fees greater than 500bps. During this month, 77 per cent of all US equity revenues were generated by specials trading. Over the six-month period, an average 78 per cent of all monthly revenues were generated by specials, which accounted for an average 3.2 per cent of all balances. As long as recall risk is managed effectively, this market has been very good at generating exceptionally strong risk-adjusted returns for lenders.
Across Asia, US$469 million was generated in specials revenue, making H1 2023 the fourth-best period since 2008. In Europe, US$279 million was generated from specials activity over the period, making it the second-best H1 for specials revenues since 2008. For EMEA, record H1 specials revenues were attained in 2016 at US$303 million.
A similar story played out across fixed income markets, with strong demand across both government and corporate bonds as interest rates continued to rise, economic data kept surprising to the upside and inflation remained stubborn across numerous jurisdictions worldwide.
Government bonds experienced increased volatility, especially over the second quarter of the year, as the US debt ceiling discussions pushed borrowing rates higher across US treasuries and caused balances to decline. Short-dated government bonds remained in demand as borrowers required additional liquidity and directional demand increased. Short-dated bonds are the most sensitive to immediate rises in interest rates and, given the lack of clarity surrounding any decline in the rate of inflation throughout the majority of the H1 period, these bonds remained in high demand throughout. Revenues generated by government bonds increased 11 per cent YoY. In contrast, average fees were 18bps, balances declined by 17 per cent YoY and utilisation contracted by 19 per cent.
Corporate bonds continued to experience gains throughout the period. Average fees hit an impressive 46bps (a 47 per cent rise YoY), pushing revenues up by 37 per cent to US$594 million. However, balances declined by an average of 8 per cent over the period. Corporate bonds have been a strong driver of revenues for the last 18 months. However, towards the end of the Q2 period the recent increases experienced in both fees and revenues started to taper off. Corporate bond revenues hit US$298 million during Q1 and declined very slightly to US$296 million during Q2.
Average fees also fell by 1bps. During June, average fees fell to 44bps, their lowest monthly average since November 2022. It is therefore possible that corporate bond returns have reached their peak.
The first half of 2023 gave securities lenders a lot to be thankful for. Higher average fees have contributed to higher revenues and, for those lenders that held any of the assets that were trading special, very strong risk-adjusted returns. Market conditions have started to change as we head into H2 and Q3. Equity markets continue to rally, inflation in the US has started to fall and the possibility of soft landings across multiple regions seems to be an increasingly likely scenario.
As always, the broader market backdrop will continue to shape activity levels in securities finance markets. Despite the recent changes in market conditions, we can conclude from H1 2023 that we should take nothing for granted. As the speed of market changing events has increased and regional economic divergences become more pronounced, pockets of opportunity are still likely to exist for some time to come.
NO FEE, NO RISK
100% ON RETURNS If you invest in only one securities finance news source this year, make sure it is your free subscription to Securities Finance Times
100% ON RETURNS If you invest in only one securities finance news source this year, make sure it is your free subscription to Securities Finance Times