Shorts outgrew longs: Positioning in 2026
13 October 2026
S3’s Sam Pierson, director of research, reviews the current market activity from the technology sector to energy, and where interest lies in long and short positions
 Image: Shutterstock
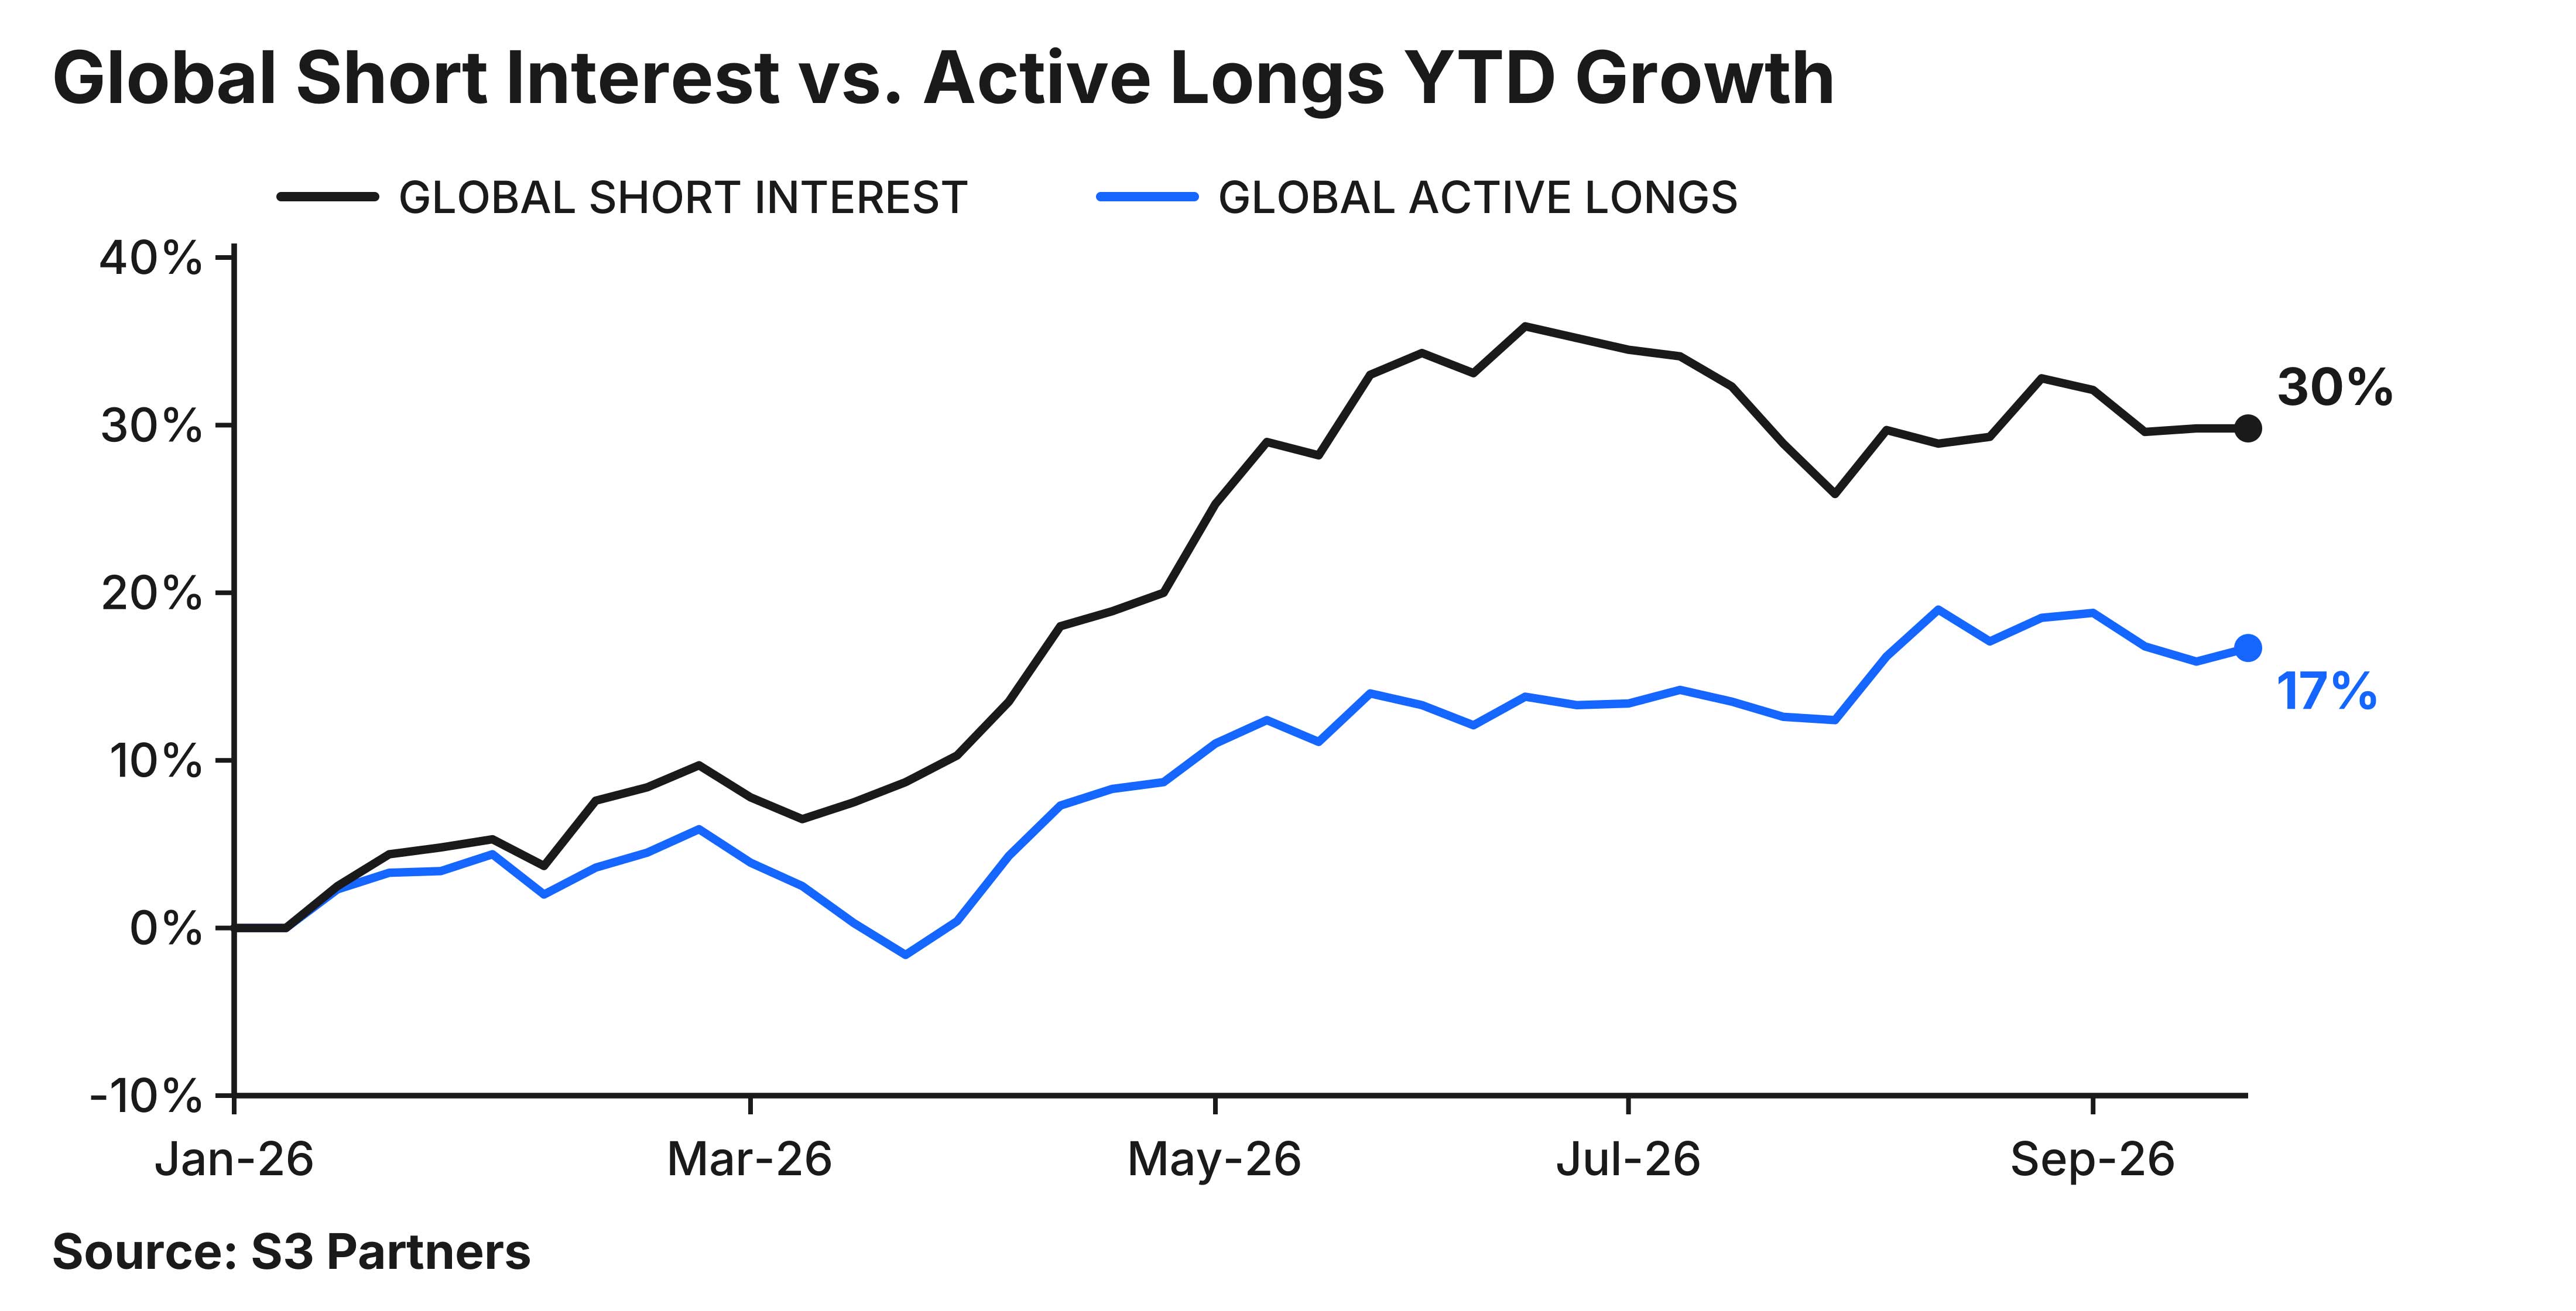
Short interest is building against rising markets. Global short interest is up 30 per cent this year to nearly US$3 trillion, while active long holdings are up 17 per cent to more than US$21 trillion across 65,000+ global securities.
Less long capital behind every short dollar. The global S3 Active Long-to-Short ratio has fallen from 8.1 to 7.3 since the start of the year: about 80 cents less of active long capital behind every dollar of short interest.
The shorts went to the technology sector. Technology drew nearly two of every five new short dollars worldwide this year, and energy is the only sector where active longs grew faster than the shorts.
Nine months into 2026, the clearest story in equity positioning is how much capital has lined up against rising markets. Short interest is up this year in all 11 sectors worldwide. The number of stocks carrying more than US$1 billion of short interest apiece has risen to 636, from 478 at the start of the year, and 1,944 are now shorted past 10 per cent of their float, up from 1,536.
Active longs remain the larger force, with 2,478 stocks each carrying more than US$1 billion of active long capital. Both sides are bigger than in January, but shorts have grown faster.
Figure 1
Most of that divergence came in one stretch. Short interest and active longs grew roughly together through February. The gap opened in March and widened into mid-June, when short interest stood 36 per cent above its year-end level. Shorts eased through July, then began rebuilding in early August.
The global Active Long-to-Short ratio hit its low of 6.7 in mid-June and has since recovered to 7.3, with technology driving both moves. The sector added US$261 billion of short interest this year, more than the next three sectors combined, and its short book grew 54 per cent against 35 per cent for active longs.
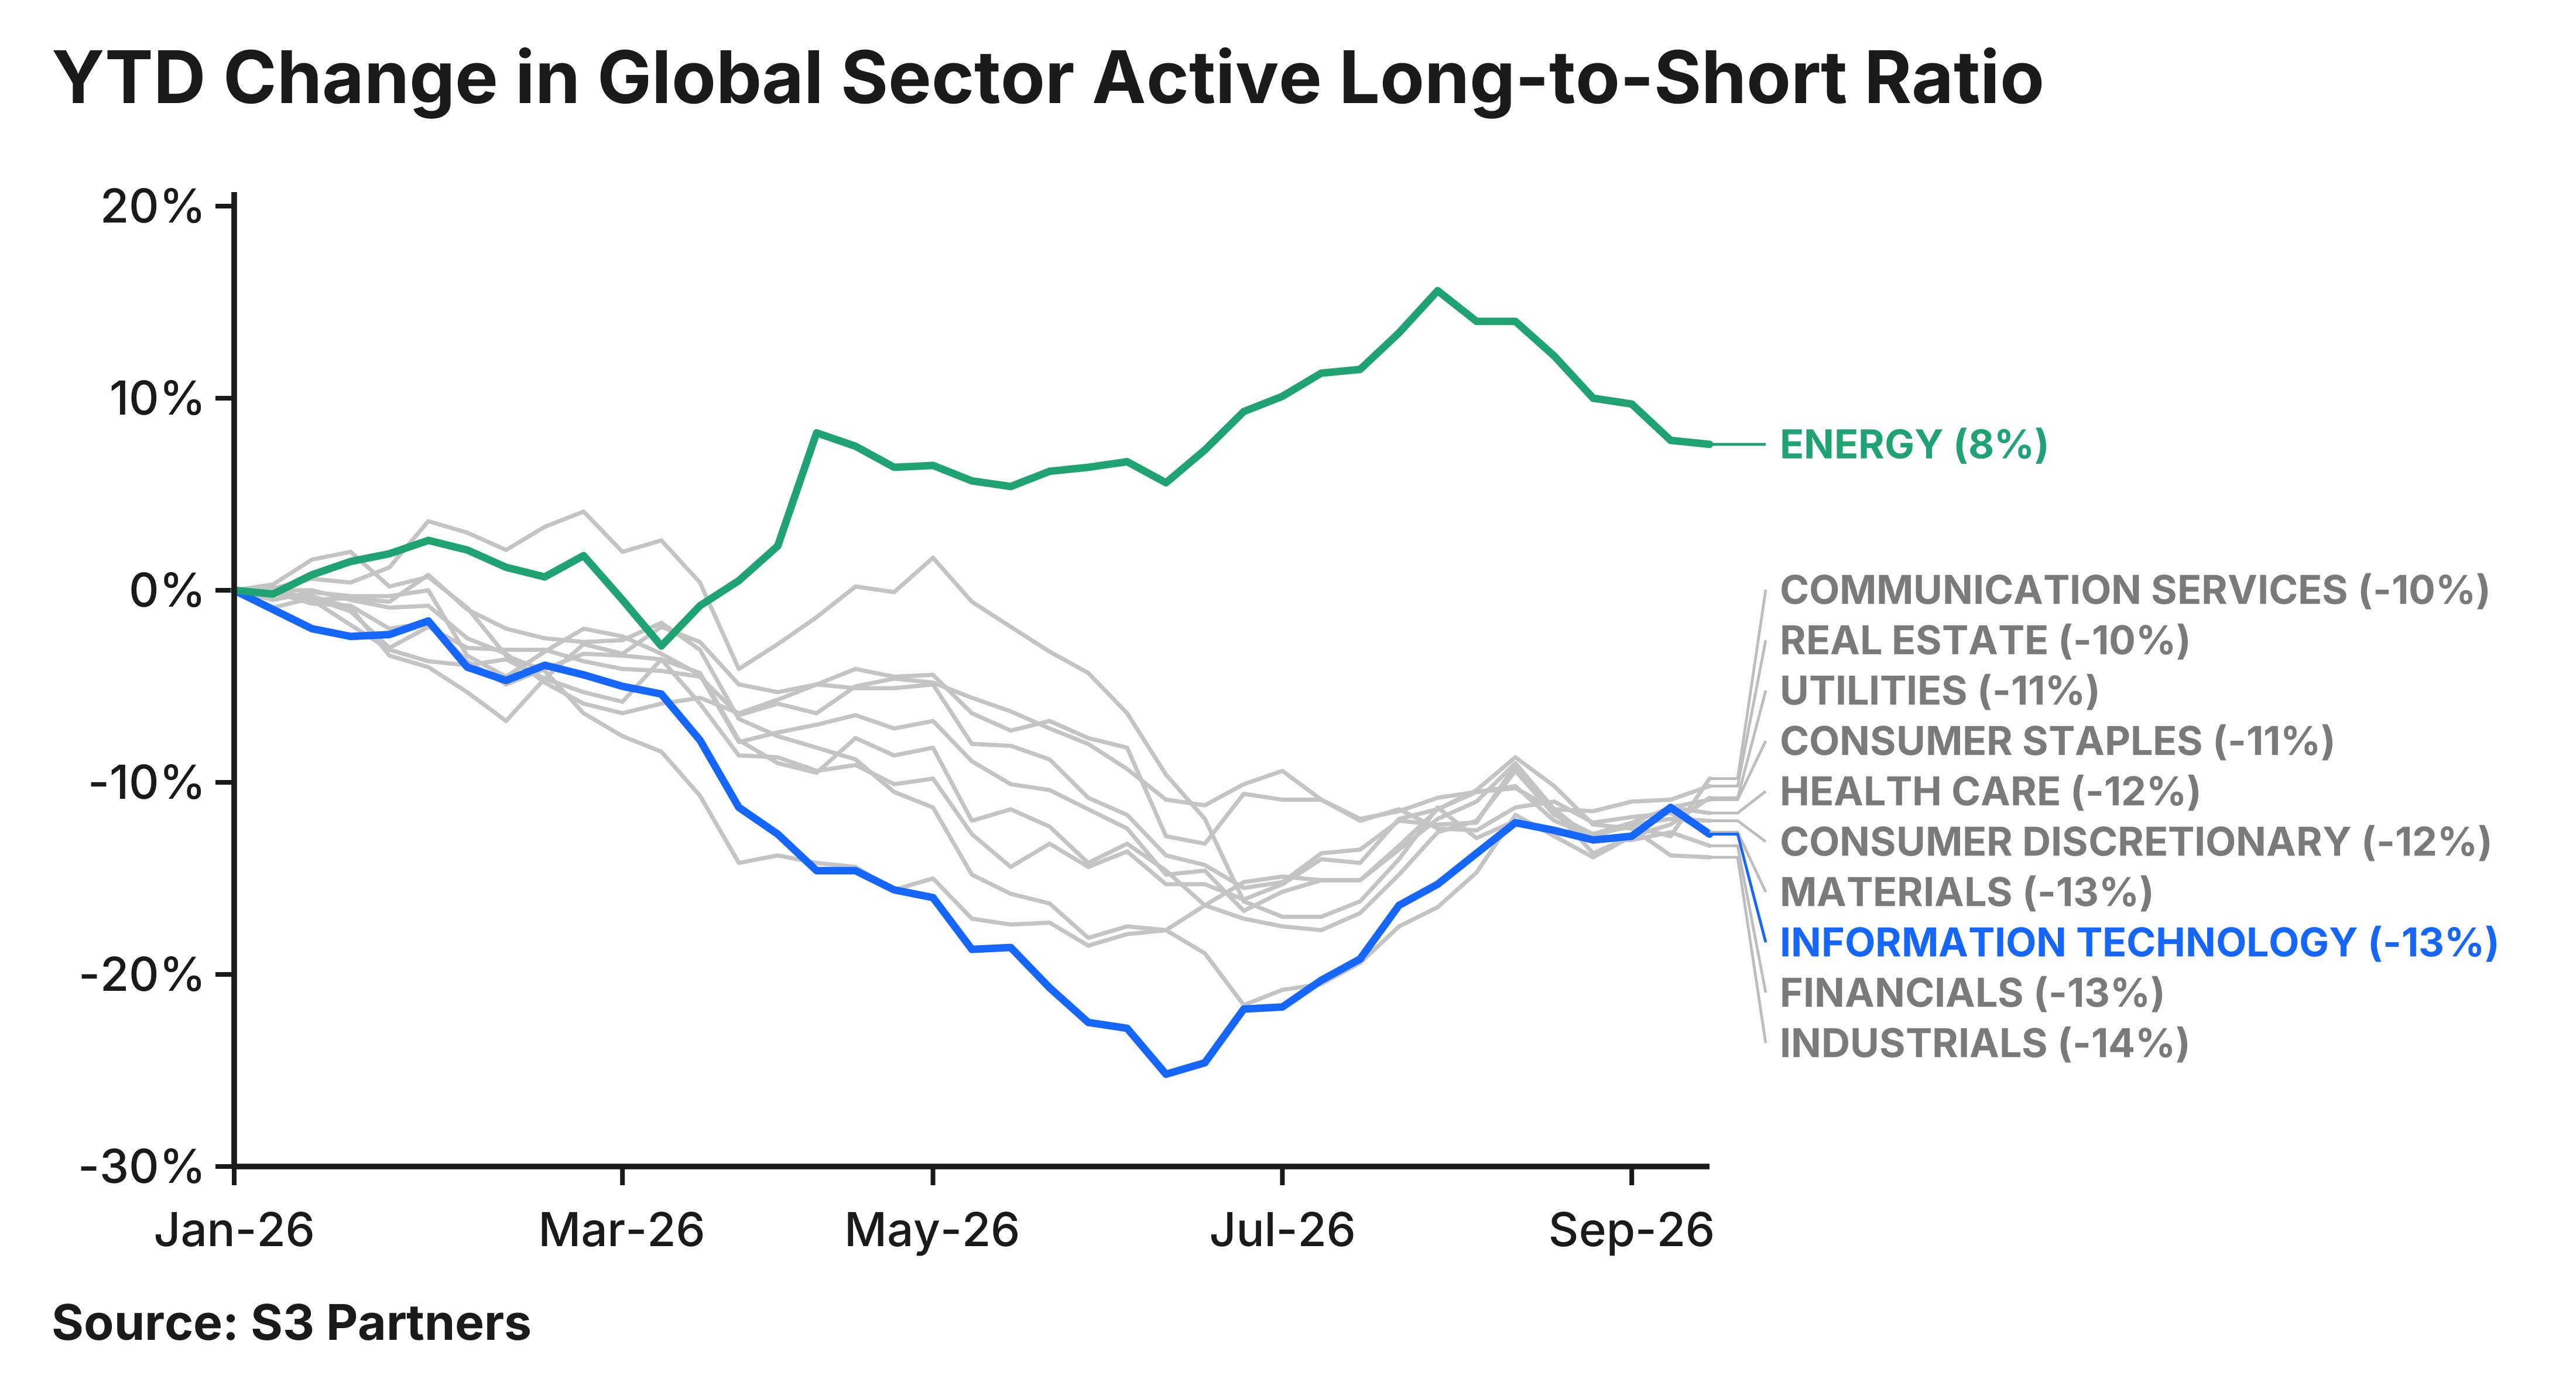
Its ratio fell further than any other sector’s into mid-June, then recovered about half of that decline as short interest fell about a sixth from its June peak and active longs slipped just two per cent. The technology sector now sits with nine other sectors in a tight cluster, all 10 below their January levels.
Energy went the other way. Active longs in the sector grew 51 per cent this year, against 40 per cent for shorts. Shorts covered twice, first in April, when they fell 14 per cent in three weeks, and again in early summer. By 31 July, energy’s ratio was up 16 per cent on the year.
Figure 2
Since then, shorts have rebuilt faster than longs and cut that gain in half, but energy is still the only sector above its January level.
Hedge funds hold nearly US$4 trillion of actively managed long positions, and the mix is shifting. Fundamental stock pickers still run the largest book at US$1.23 trillion, but Quant, up 33 per cent this year against Fundamental’s 10, is US$70 billion behind and closing. The gap was US$240 billion in December. Quant already leads in the Americas, and at the current pace it takes the top spot globally by the end of 2026.
Through September, global equity short positions have grown nearly twice as fast as active longs, and the long capital behind every short dollar has fallen from US$8.1 to US$7.3. That pressure does not spread evenly. One group to watch is what S3 defines as ‘battlegrounds’ — stocks with committed capital on both sides, where price moves fastest when one side gives way. Rising prices have come with rising doubt.
Less long capital behind every short dollar. The global S3 Active Long-to-Short ratio has fallen from 8.1 to 7.3 since the start of the year: about 80 cents less of active long capital behind every dollar of short interest.
The shorts went to the technology sector. Technology drew nearly two of every five new short dollars worldwide this year, and energy is the only sector where active longs grew faster than the shorts.
Nine months into 2026, the clearest story in equity positioning is how much capital has lined up against rising markets. Short interest is up this year in all 11 sectors worldwide. The number of stocks carrying more than US$1 billion of short interest apiece has risen to 636, from 478 at the start of the year, and 1,944 are now shorted past 10 per cent of their float, up from 1,536.
Active longs remain the larger force, with 2,478 stocks each carrying more than US$1 billion of active long capital. Both sides are bigger than in January, but shorts have grown faster.
Figure 1
Most of that divergence came in one stretch. Short interest and active longs grew roughly together through February. The gap opened in March and widened into mid-June, when short interest stood 36 per cent above its year-end level. Shorts eased through July, then began rebuilding in early August.
The global Active Long-to-Short ratio hit its low of 6.7 in mid-June and has since recovered to 7.3, with technology driving both moves. The sector added US$261 billion of short interest this year, more than the next three sectors combined, and its short book grew 54 per cent against 35 per cent for active longs.
Its ratio fell further than any other sector’s into mid-June, then recovered about half of that decline as short interest fell about a sixth from its June peak and active longs slipped just two per cent. The technology sector now sits with nine other sectors in a tight cluster, all 10 below their January levels.
Energy went the other way. Active longs in the sector grew 51 per cent this year, against 40 per cent for shorts. Shorts covered twice, first in April, when they fell 14 per cent in three weeks, and again in early summer. By 31 July, energy’s ratio was up 16 per cent on the year.
Figure 2
Since then, shorts have rebuilt faster than longs and cut that gain in half, but energy is still the only sector above its January level.
Hedge funds hold nearly US$4 trillion of actively managed long positions, and the mix is shifting. Fundamental stock pickers still run the largest book at US$1.23 trillion, but Quant, up 33 per cent this year against Fundamental’s 10, is US$70 billion behind and closing. The gap was US$240 billion in December. Quant already leads in the Americas, and at the current pace it takes the top spot globally by the end of 2026.
Through September, global equity short positions have grown nearly twice as fast as active longs, and the long capital behind every short dollar has fallen from US$8.1 to US$7.3. That pressure does not spread evenly. One group to watch is what S3 defines as ‘battlegrounds’ — stocks with committed capital on both sides, where price moves fastest when one side gives way. Rising prices have come with rising doubt.
NO FEE, NO RISK
100% ON RETURNS If you invest in only one securities finance news source this year, make sure it is your free subscription to Securities Finance Times
100% ON RETURNS If you invest in only one securities finance news source this year, make sure it is your free subscription to Securities Finance Times